
Spatial Data Visualization and Statistics
Spatial Data Visualization and Statistics
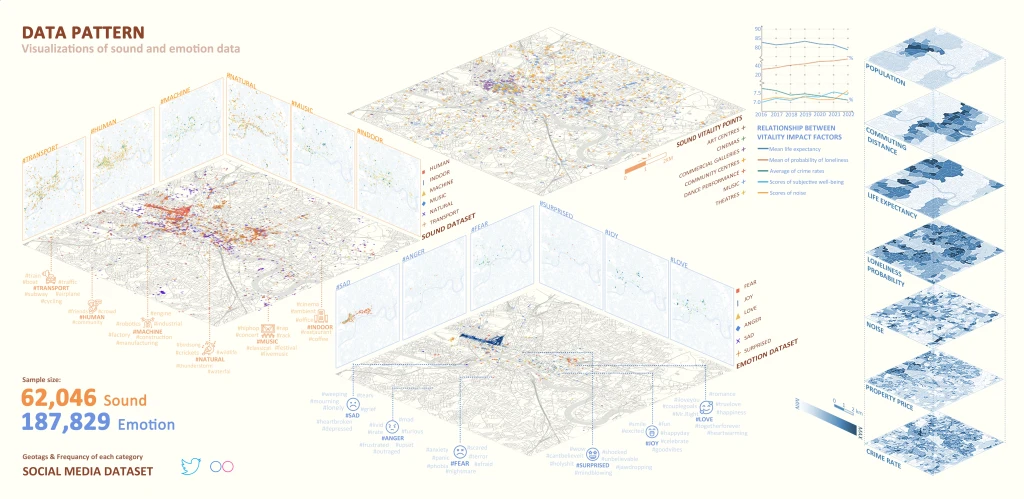
Spatial Data Visualization and Statistics refers to the process of transforming geographic data into intuitive maps, charts, and quantitative indicators to reveal spatial patterns and relationships. By combining visualization techniques with spatial statistical methods such as clustering, autocorrelation, and regression models, it enables researchers and planners to identify hotspots, analyze inequalities, and simulate future trend.
Spatial Data Visualization and Statistics
Spatial Data Visualization and Statistics refer to the process of transforming geographic data into intuitive maps, charts, and quantitative indicators to reveal spatial patterns and relationships. By combining visualization techniques with spatial statistical methods such as clustering, autocorrelation, and regression models, it enables researchers and planners to identify hotspots, analyze inequalities, and simulate future trend.