Services
Our Services
Our lab is committed to producing high-impact research and transformative projects that address pressing environmental and social issues. We actively collaborate with academic institutions, industry partners, and community organizations to drive meaningful change and disseminate our findings to a broader audience.
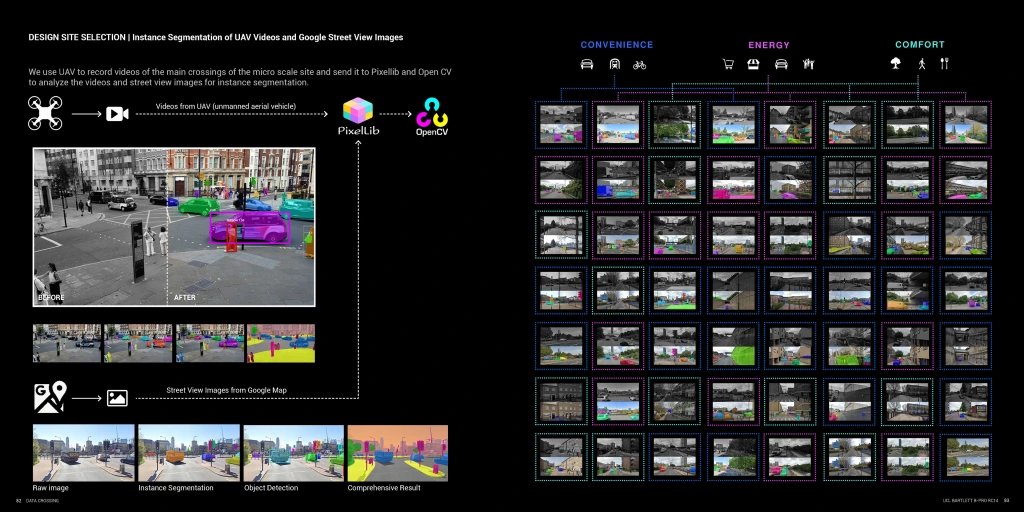
Utilizing advanced deep learning techniques to analyze diverse data sources, including street view imagery, Flickr, and Google Reviews, to gain nuanced insights into urban environments.
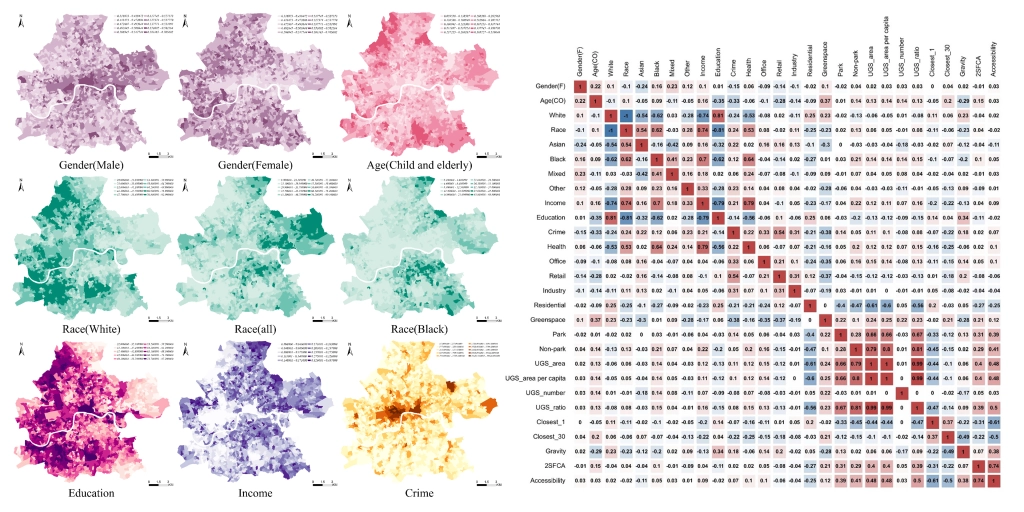
Social-economic Data Scraping and Mapping refers to the collection of demographic, economic, and social indicators from diverse digital sources, such as government open data portals, census databases, online platforms, and statistical reports. Their integration into geospatial frameworks for analysis.
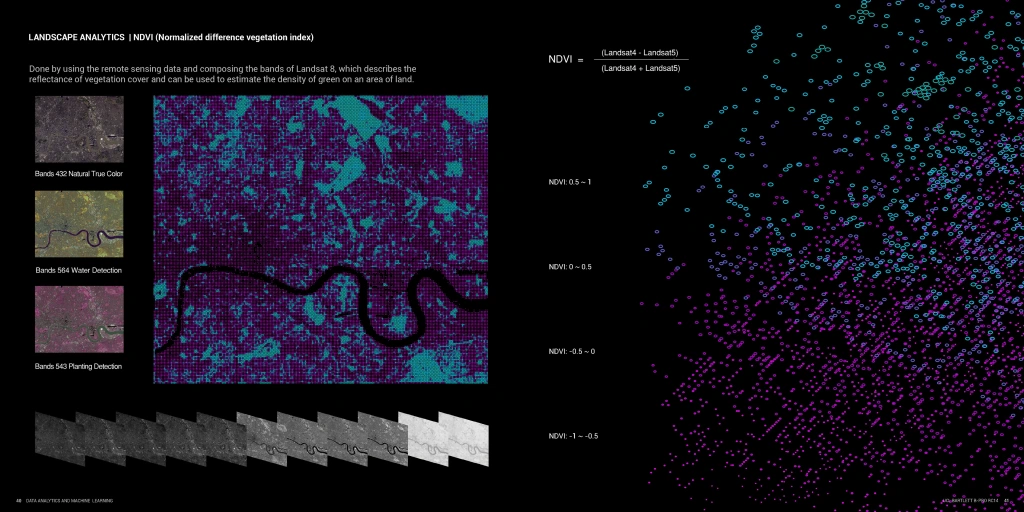
Remote Sensing and GIS refers to the combined use of satellite imagery, aerial photography, and geospatial information systems to capture, analyze, and manage spatial data at multiple scales. Remote sensing provides continuous, large-area observations of land cover, vegetation health, water resources, and urban morphology, while GIS integrates these datasets with demographic, infrastructural, and environmental information.
Smart Sensor Deployment and Visualization refers to the integration of sensor networks into urban spaces to capture fine-grained, real-time data on environmental and social dynamics. These sensors may include air quality monitors, noise detectors, traffic counters, energy meters, and motion sensors strategically placed across streets, parks, and infrastructure nodes.
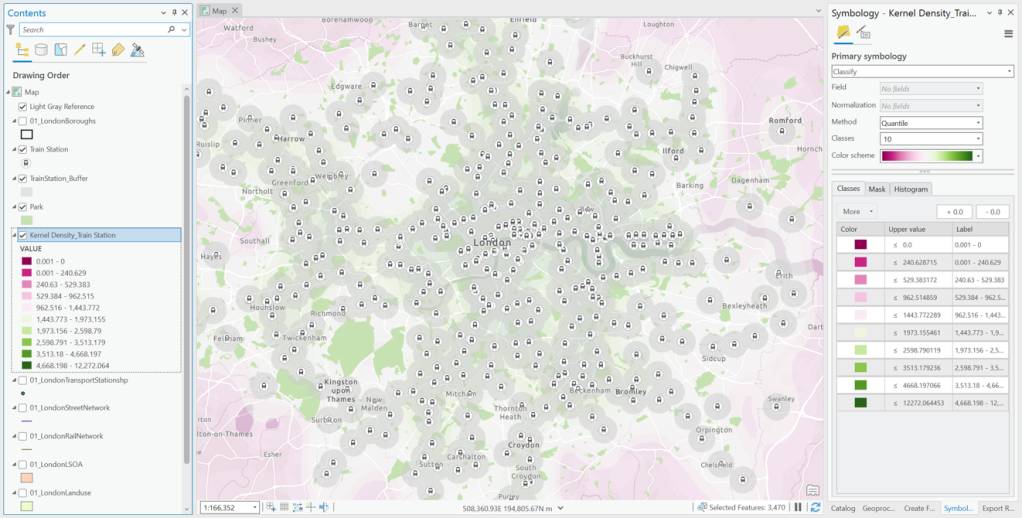
The Transportation and Mobility dataset is a structured collection of spatial and behavioral data that records how people and goods move through urban and regional environments. It includes information on road networks, public transit systems, travel demand, commuting patterns, traffic flow, and accessibility across multiple transport modes.
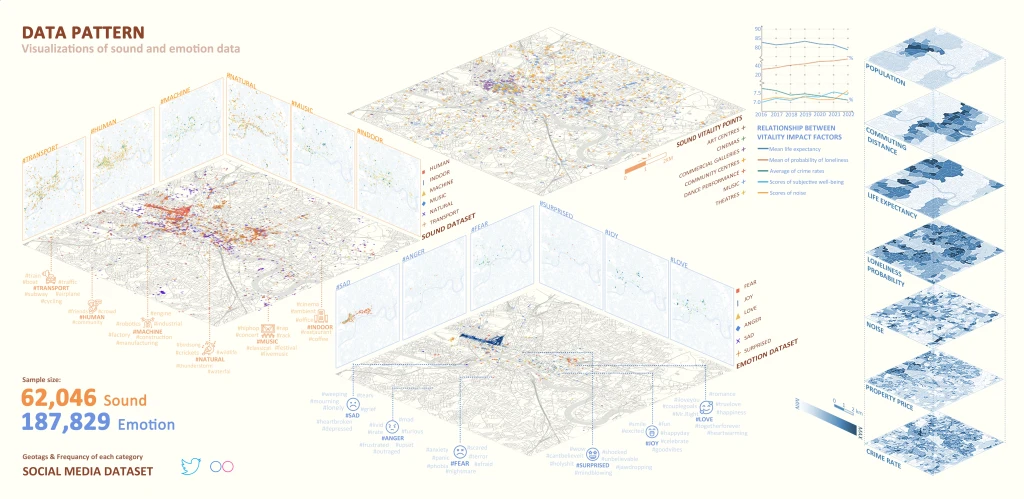
Spatial Data Visualization and Statistics refers to the process of transforming geographic data into intuitive maps, charts, and quantitative indicators to reveal spatial patterns and relationships. By combining visualization techniques with spatial statistical methods such as clustering, autocorrelation, and regression models, it enables researchers and planners to identify hotspots, analyze inequalities, and simulate future trend.
Discover a world of possibilities
Welcome to a world of limitless possibilities, where the journey is as exhilarating as the destination, and where every moment is an opportunity to make your mark on the canvas of existence. The only limit is the extent of your imagination.