
Urban Climate has published our new study on urban scene characteristics and the urban heat island effect in New York City. We apply interpretable machine learning (SHAP, ALE, and counterfactual analysis) to reveal how building height, vegetation coverage, and socio-economic disparities shape land surface temperature. These findings provide actionable insights for climate-resilient and equitable urban planning.
Nature AI Lab
2025-07-27
We are glad to share our new paper:
Hongqian Li, Yuxuan Cai, Yidong Yang, Xinran Cai (2025). Assessing the influence of urban scene characteristics on urban heat island: An interpretable machine learning approach in New York City. Urban Climate, 62, 102542. | https://doi.org/10.1016/j.uclim.2025.102542
📢 Background :
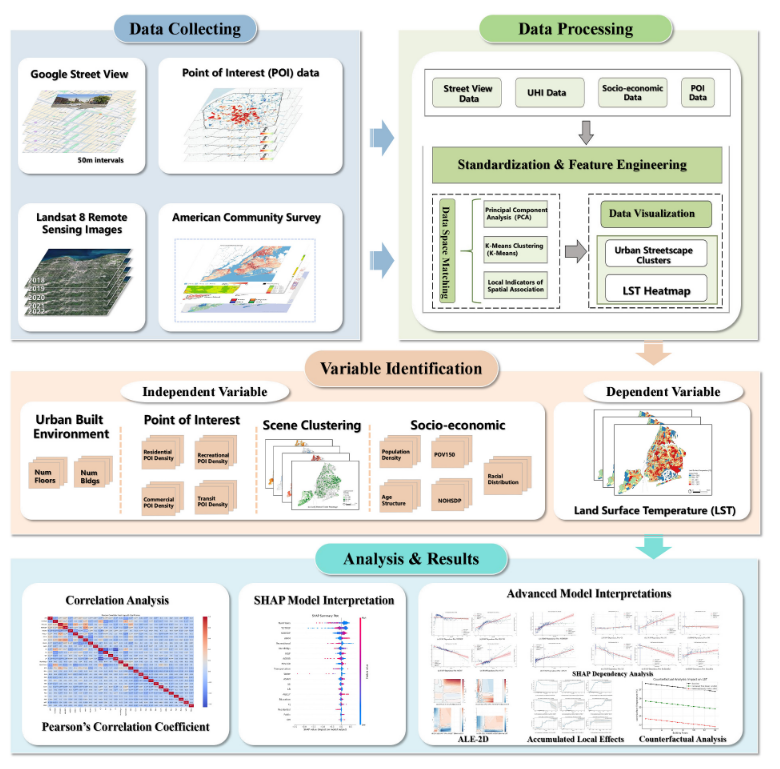
Cities often overlook micro-scale factors that drive urban heat. Previous Urban Heat Island (UHI) studies have primarily focused on land use or satellite-derived indicators, paying little attention to how street-level environments shape local thermal conditions. To achieve climate-resilient planning, it is essential to integrate these fine-grained features with social vulnerability, as neighborhoods with sparse greenery, low-rise buildings, or high poverty levels face elevated heat risks that remain underexplored in existing research.
🔍 Research Objectives and Question :
This study is grounded in the concepts of environmental inequality and urban microclimate dynamics. It hypothesizes that the urban heat island (UHI) effect is strongly influenced by fine grained street level morphology, vegetation coverage, and socio-economic conditions. These factors work together to generate spatially unequal thermal risks, placing a heavier burden on vulnerable communities. To address these issues, the research is guided by three main objectives:
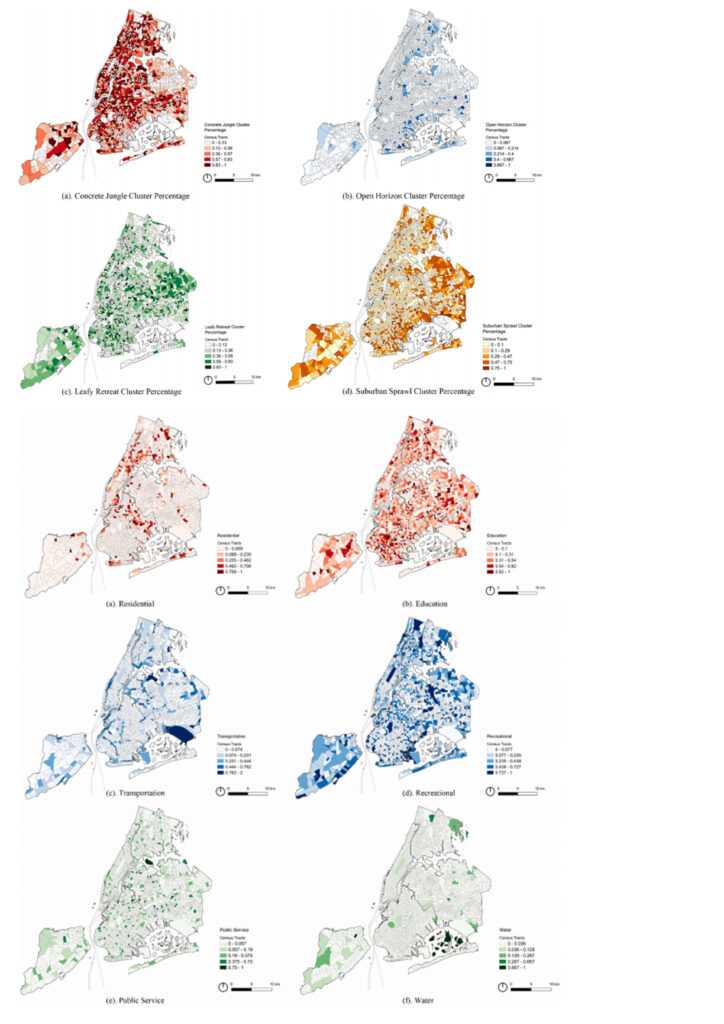
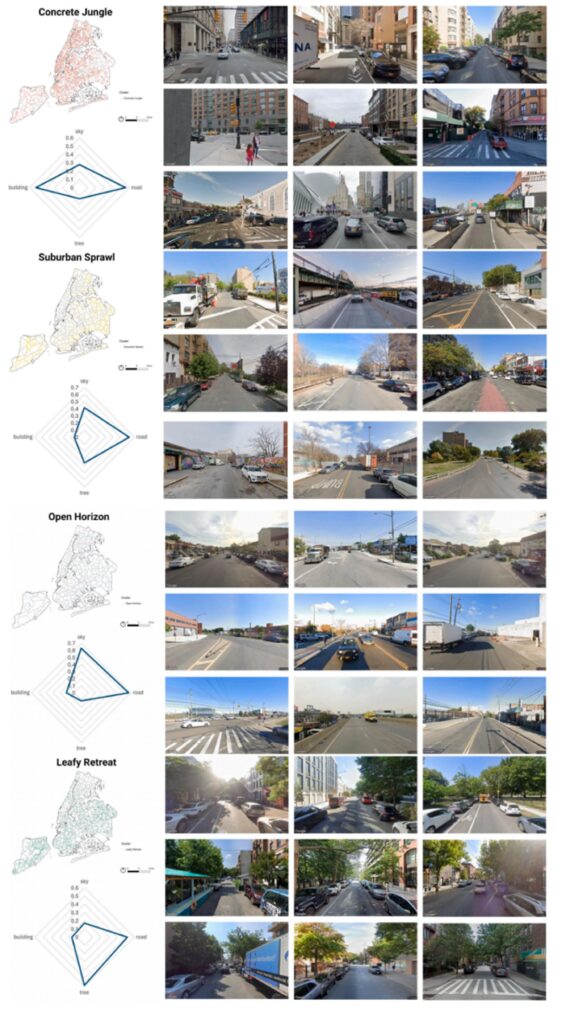
(1)How can street view imagery be used to define and classify urban scenes in New York City, and what is their spatial distribution?
(2)How do micro-level urban morphology, POI, and Social-Economic these features correlate with the Urban Heat Island effect? and how can both linear and non-linear models (with SHAP interpretability) explain these relationships?
(3)How do these features and UHI relationships vary across different socioeconomic contexts, revealing potential environmental inequalities?
🔍 Key Highlights:
Planning implications: This research presents a data-driven framework aimed at facilitating equitable urban climate adaptation. The emphasis is on the necessity for UHI mitigation strategies to be tailored rather than uniform, prioritizing investments in underserved neighborhoods through targeted greening initiatives (such as tree planting, cool roofs, and recreation corridors) and zoning reforms aimed at reducing thermal risk for marginalized populations.
Vegetation thresholds and urban cooling:
Micro-scale analysis reveals a clear pattern of urban heat regulation. When tree canopy coverage exceeds 28%, land surface temperature is consistently reduced. Conversely, low-rise and high-density zones without adequate green infrastructure, particularly “Suburban Sprawl” areas, significantly intensify the heat island effect.
Built form effects:
Contrary to common assumptions, taller buildings (above 3–6 floors) are associated with cooler temperatures due to shading and vertical ventilation. The study quantifies that each additional floor reduces LST by approximately 0.40°C, especially when combined with green elements.
Environmental and social inequity:
Neighborhoods with high poverty rates, low educational attainment, and large minority populations (Black, Hispanic, Asian) are more exposed to extreme surface heat. These areas often coincide with low vegetation, poor infrastructure, and inadequate cooling resources, reinforcing patterns of environmental injustice.