
I designed these two courses around a question that also sits at the centre of my own research: once we can measure urban nature with AI, what should we actually do with the result?
Over one month at the 2026 UBC Forestry Summer Institute, I taught two related but distinct courses for two cohorts of 30 students. AI in Green Space & Public Health Management connected forests and urban green space with health, equity and place-based management. Ecological Environment and Sustainable Development – AI Empowering the Green Future took a broader sustainability lens, asking how environmental data and AI can support ecological understanding and action across scales.
The subject matter was different, but the educational challenge was shared. Students arrived with varied disciplinary and technical backgrounds, so neither course began with code. We began with places and questions people could recognize: a shaded path, a hot bus stop, a restorative forest, an urban park, and a neighbourhood that looks green from above but not at eye level.
Two courses, one connected learning architecture
The courses did not have the same theme, and the distinction matters. One centred green space and public health; the other centred ecological environments and sustainable development. What connected them was a shared progression from environmental question to evidence, field experience and responsible action.
AI in Green Space & Public Health Management 2026
Students examined how forests and urban green spaces influence thermal comfort, air quality, mental well-being, physical activity and equity. AI and spatial methods were used to support place-specific management and public-health decisions.
UBC course pageEcological Environment and Sustainable Development – AI Empowering the Green Future 2026
Students explored how remote sensing, street-level vision, environmental sensing and AI can help interpret ecological change and support more sustainable urban and environmental futures.
UBC course pageEstablish the problem frame
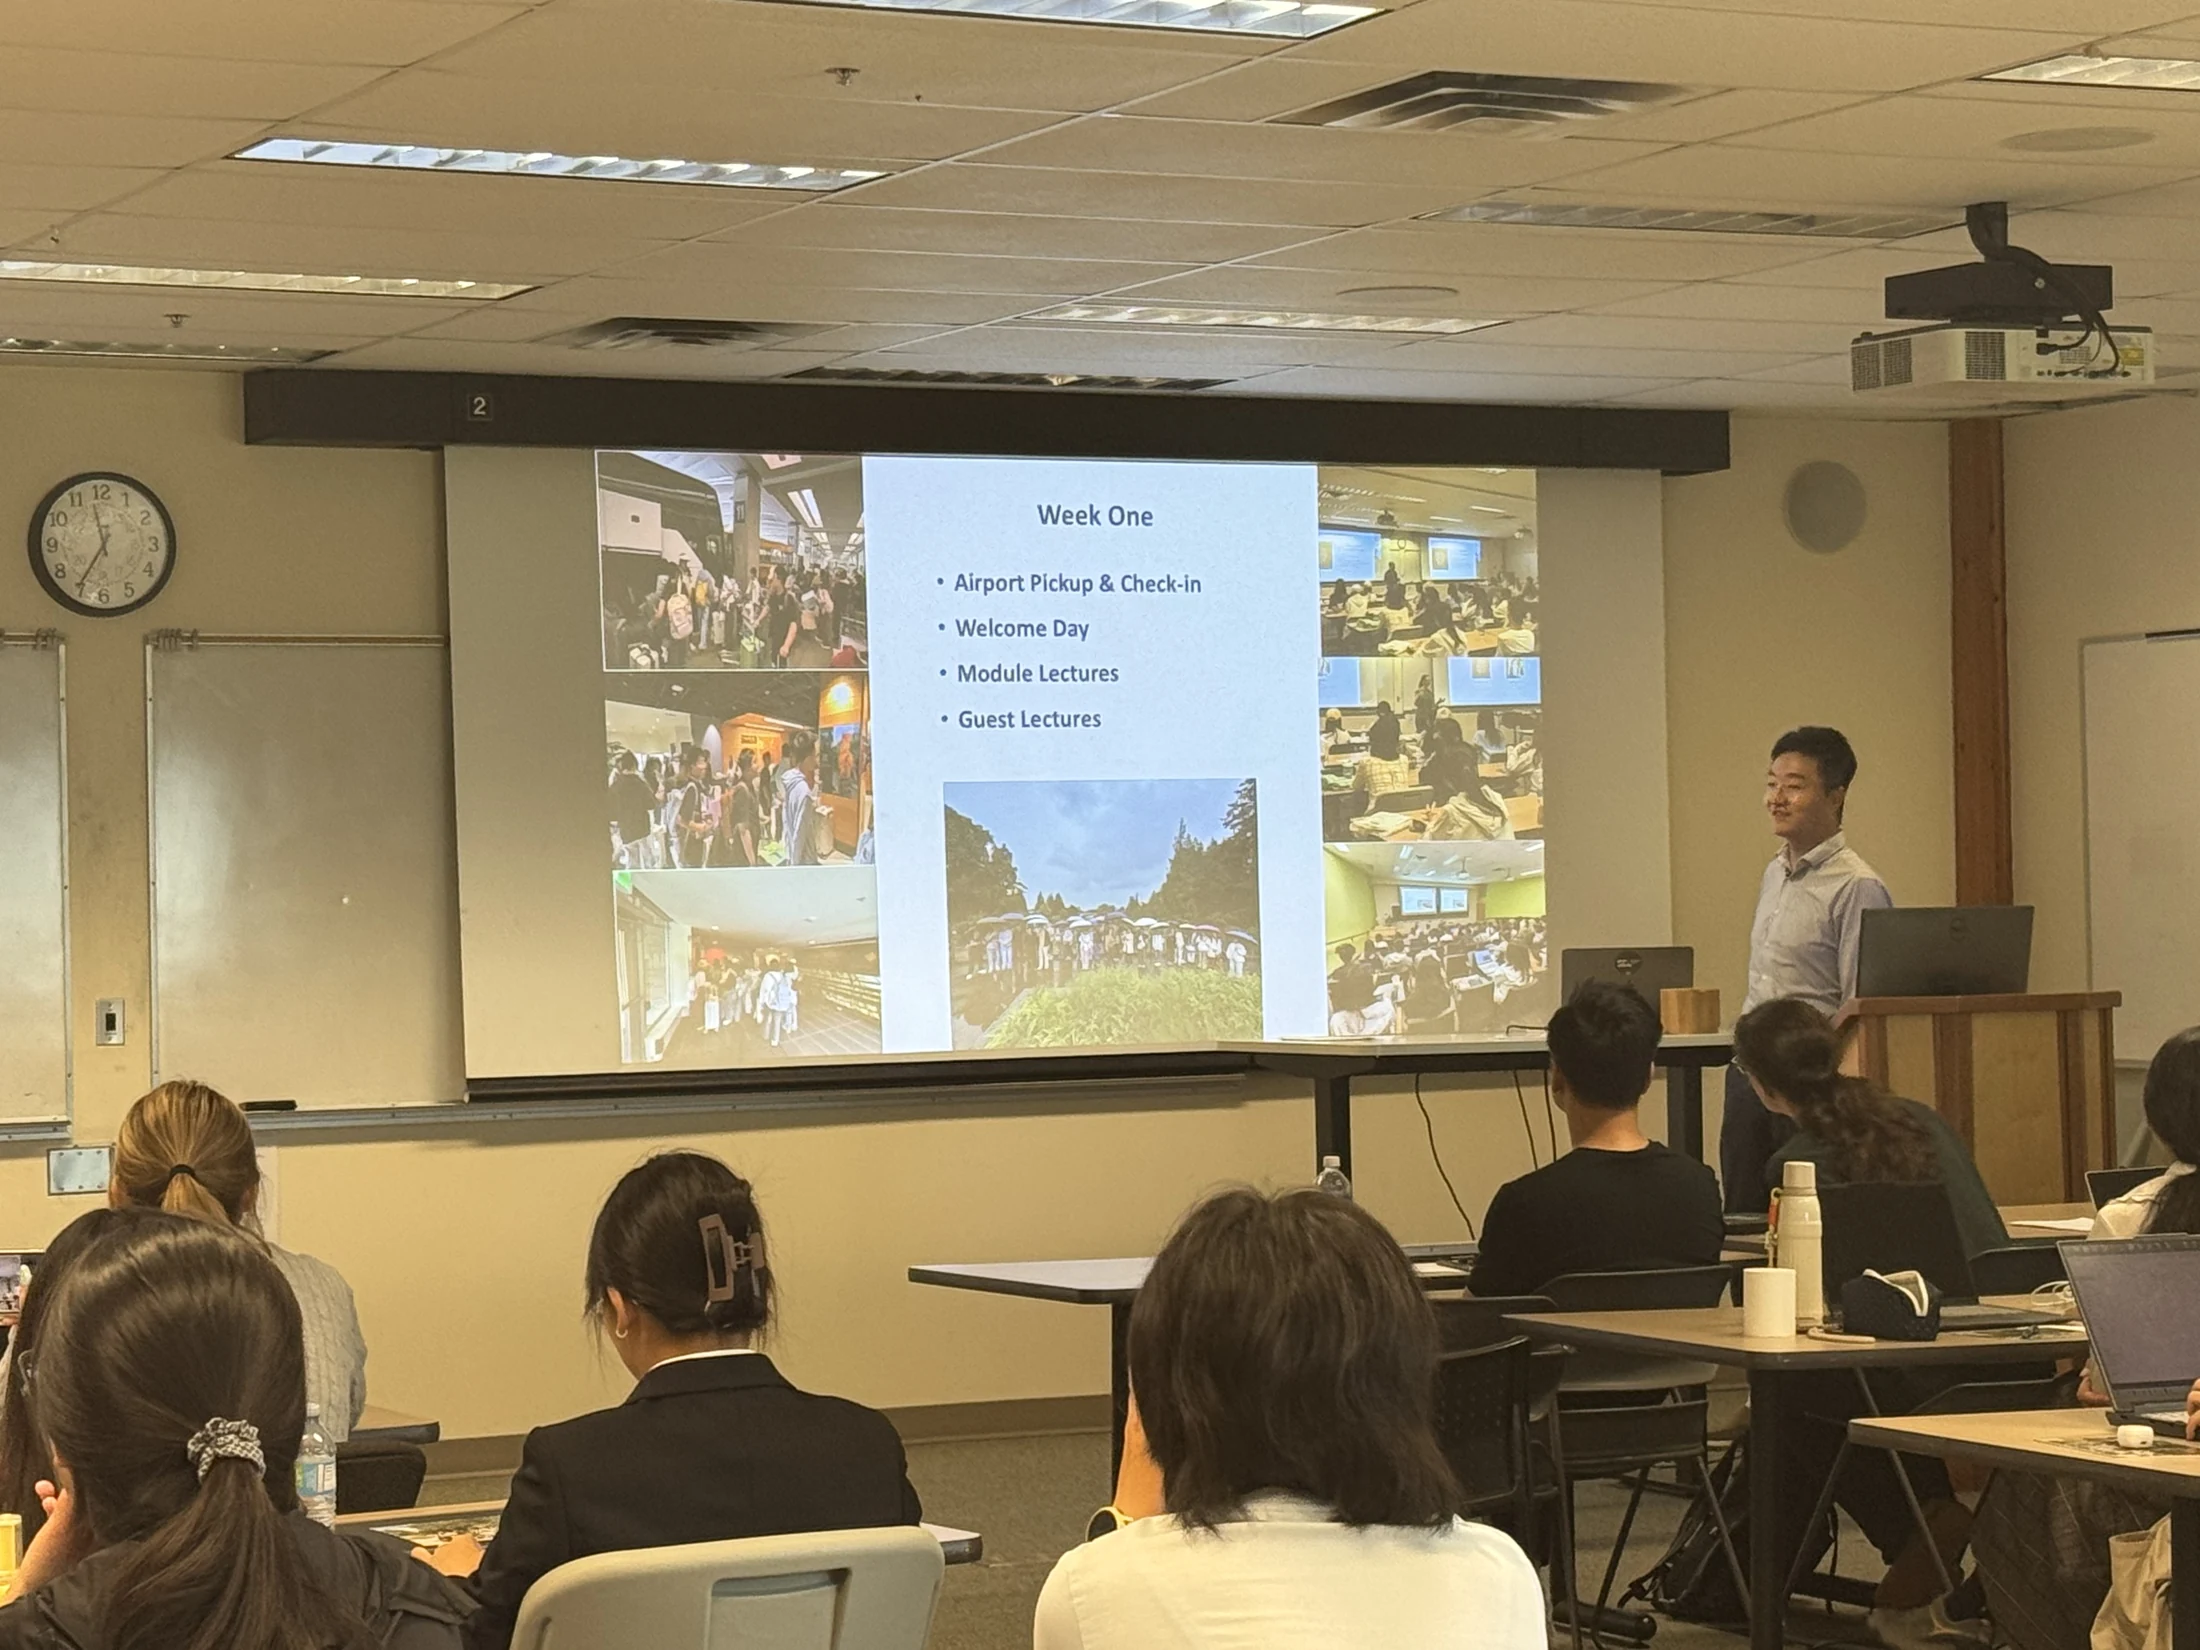
Each cohort began from its own environmental focus. Students connected green space with public health or located AI within wider questions of ecology and sustainable development, then built a working vocabulary for environmental data.
See and measure at multiple scales
Satellite imagery, street-view segmentation, sensors and systematic observation were taught as complementary lenses. Students compared what could be seen from above, from the street and from within a park.
Translate evidence into action
Students moved from diagnosis to design, policy and management. Ethics, bias, environmental justice and governance were assessed as part of the proposal, not left as an afterthought.
See it. Measure it. Act on it. Question it.
This became the shared rhythm across both courses. A student could enter through design, ecology, public health or computation, but the same four prompts kept the learning connected. They also kept the technology in its proper place: useful, specific and open to challenge.
Begin with the decision, not the model
Students first named a place, stakeholder and focused question. Only then did they choose NDVI, GVI, field counts, sensors or vision models.
Make scale disagreement productive
Satellite canopy, street-level visibility and human use often tell different stories. Comparing them became a source of insight rather than an error to hide.
Grade judgment as well as technique
The strongest work did not simply produce a map. It bounded the claim, identified missing evidence, and proposed a feasible next step with an equity safeguard.
Communicate the same inquiry in four forms
The final assessment combined an individual essay, five-minute talk, collaborative synthesis and public-facing poster—testing reasoning, speaking, teamwork and visual hierarchy.
We used the tool that matched the question
There was no single “AI tool” behind the two courses. Students moved between four kinds of evidence and learned why each one gives a partial view. We worked mainly in free or open environments so that students could keep experimenting after the program ended.
Satellite and spatial analysis
Vegetation, surface temperature and land-cover patterns helped students see neighbourhood and regional differences before they zoomed into a site.
Street imagery and computer vision
Students compared overhead greenness with what a pedestrian can actually see, then used semantic segmentation to calculate Green View Index.
Sensing and observation
Field counts, geotagged images and environmental sensing made visible the people, movements and micro-conditions that a satellite cannot capture.
Analysis and communication
Notebooks and maps gave students a reproducible path from raw data to a claim they could explain, question and revise.
Continuing the work at Nature AI Lab
The courses also connected with the Lab’s growing platform and toolkit ecosystem. The related open tools extend the same multi-scale way of seeing nature, from satellite landscapes and street scenes to human experience in parks.
Two researchers widened the frame
Within AI Empowering the Green Future, guest lectures were placed where students were ready to connect a method with a larger practice: first, how AI can open new design possibilities; later, how sensing can reveal inequality that a city-wide average hides.
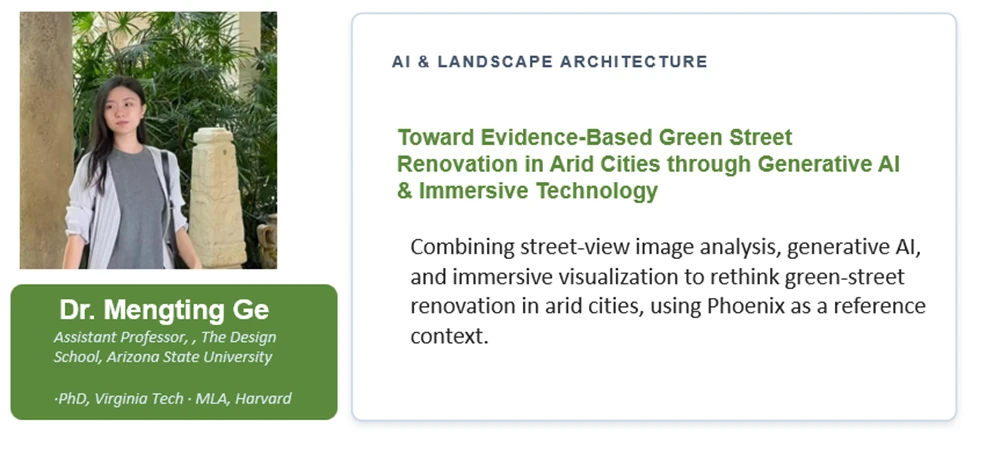
Dr. Mengting Ge
Assistant Professor, The Design School, Arizona State University · PhD, Virginia Tech
Toward Evidence-Based Green Street Renovation in Arid Cities through Generative AI & Immersive Technology used Phoenix as a reference point. Students saw how street-view analysis, generative AI and immersive visualization can work together—not simply to make images, but to compare alternatives and communicate design choices.
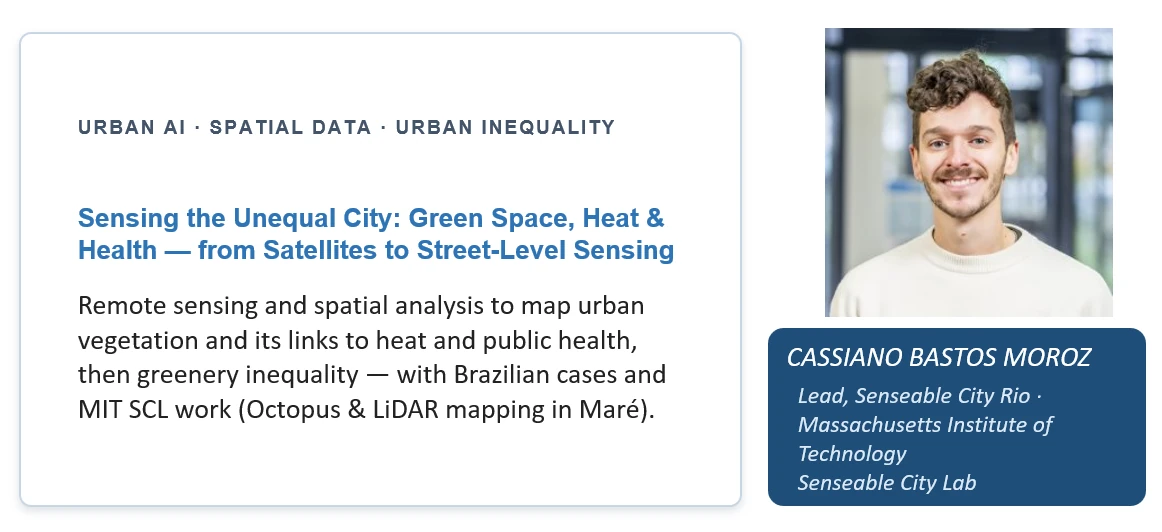
Dr. Cassiano Bastos Moroz
Lead, Senseable City Rio · MIT Senseable City Lab
Sensing the Unequal City: Green Space, Heat & Health—from Satellites to Street-Level Sensing moved between remote sensing, spatial analysis and fine-grained urban observation. Brazilian cases and MIT Senseable City Lab work showed why heat, greenery and health have to be read together—and why the street can tell a different story from the satellite.
The city became our second classroom
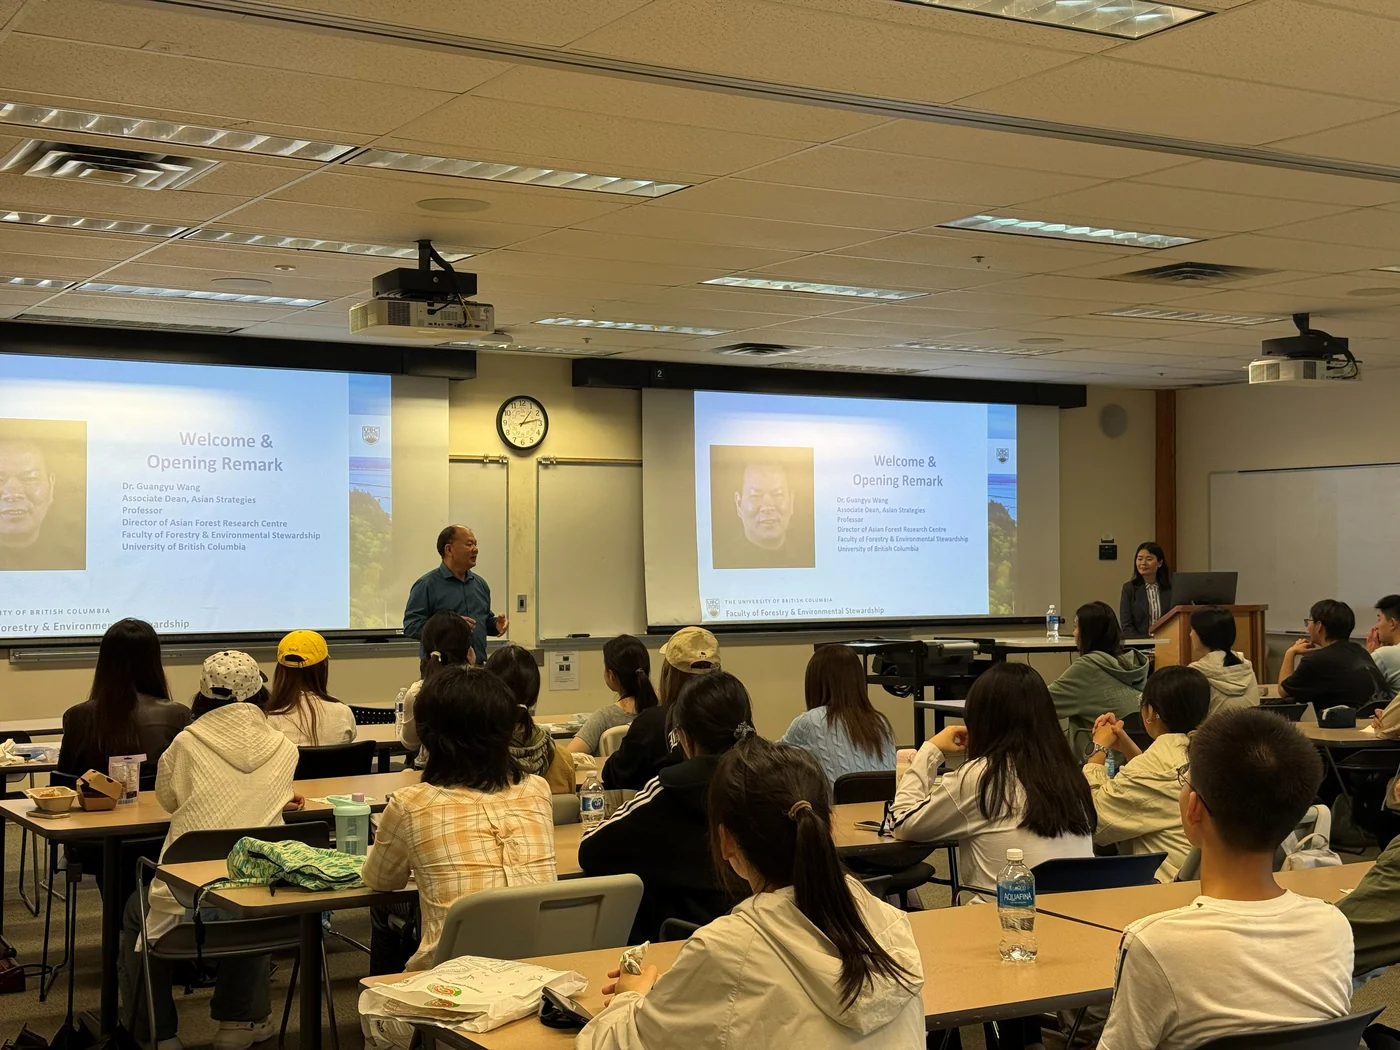
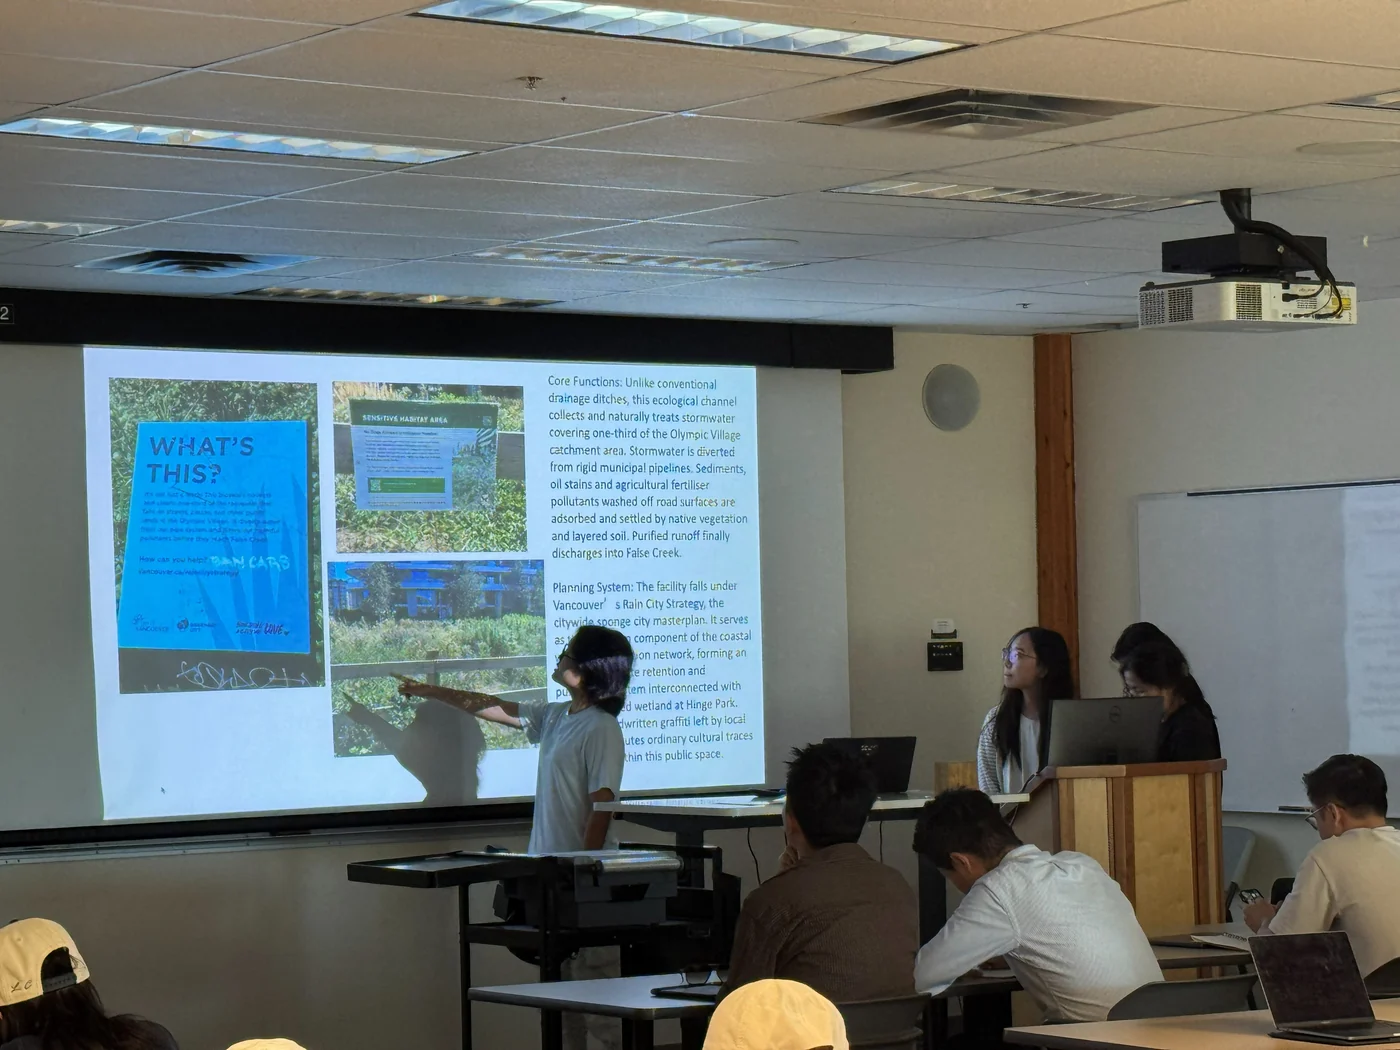
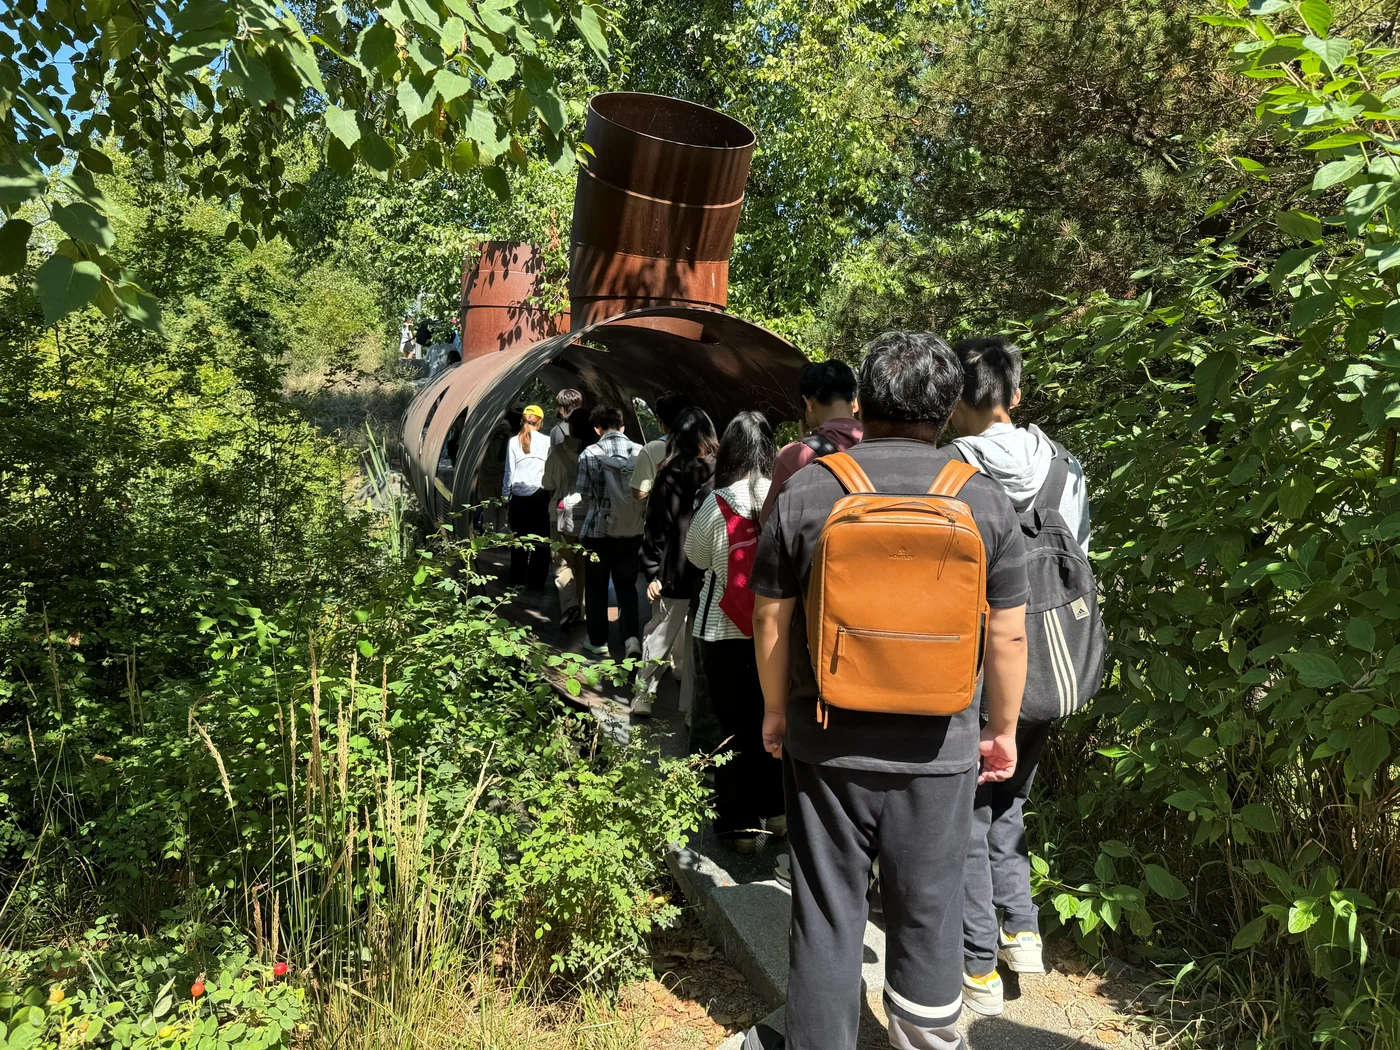
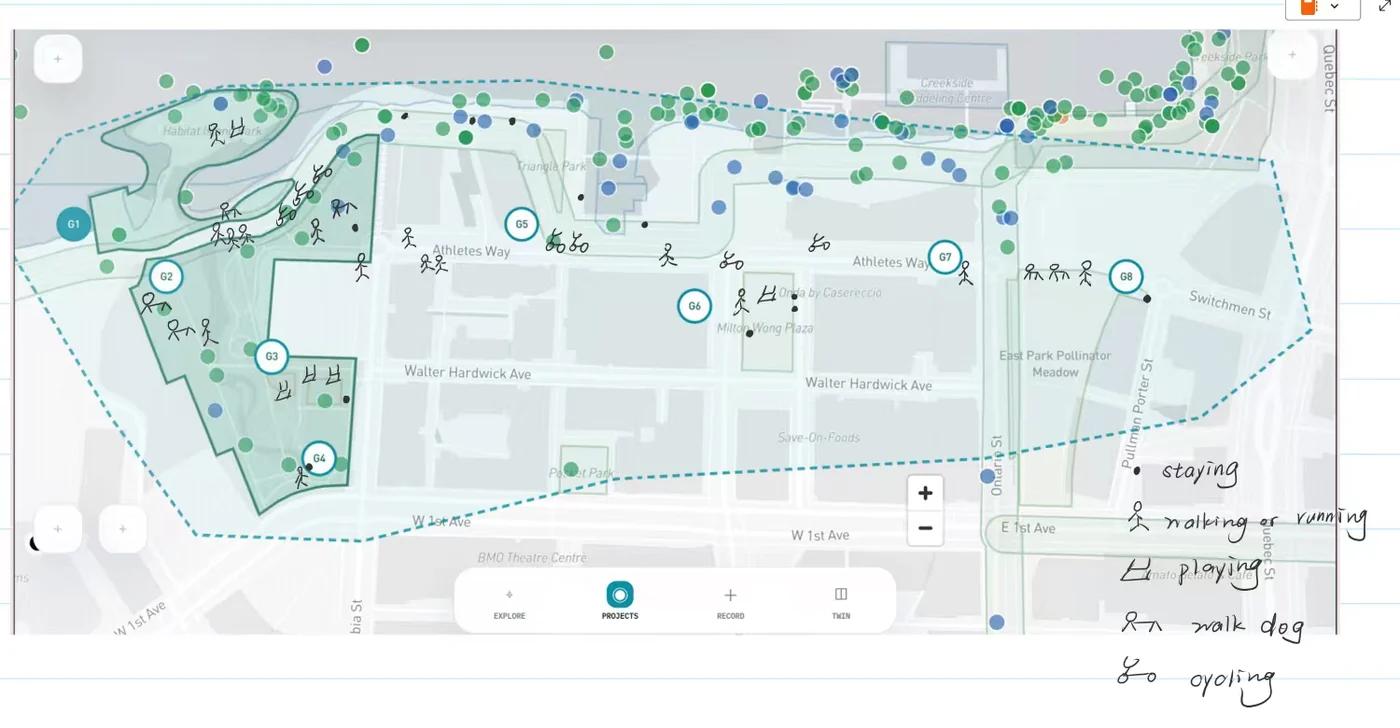
At Malcolm Knapp Research Forest, students slowed down and noticed how forest structure, sound, shade and accessibility shape a restorative experience. At Hinge Park, teams from the two cohorts worked through four Human–Nature Interaction lenses: presence, movement, activity and semantic experience.
Students collected geotagged, pedestrian-perspective images and field notes. Across the two cohorts, their contributions were brought together in a shared Urban Nature Digital Twin. The twin was not produced by a model alone. It reflected where students walked, what they noticed and how they interpreted the same place differently.
Explore the interactive ParkTwin below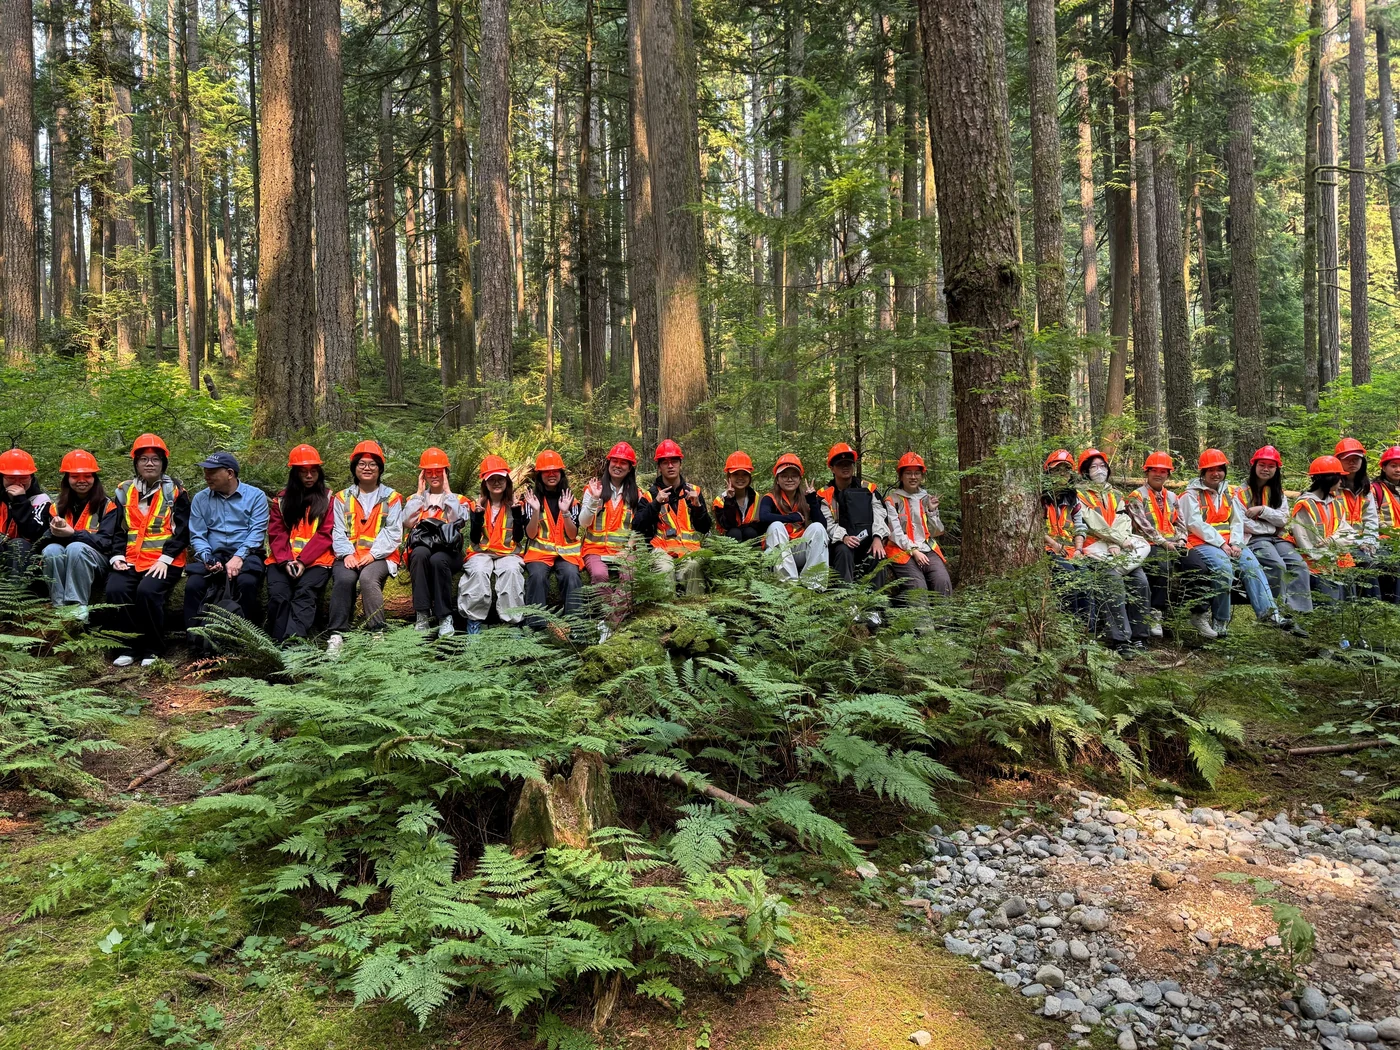
Hinge ParkTwin
Explore how students moved through Hinge Park and Olympic Village, where they paused, and what they recorded. Use the map filters to compare group routes, field observations and visual evidence, then move between Atlas, Signals, Report and Frames.
Open the ParkTwin full screenWhat students remembered was doing the work
In the available post-course survey, field visits were the most frequently selected preferred learning activity. Respondents also pointed to hands-on labs, real cases, clear lectures and group discussion as the moments when AI, sensing and GIS stopped being abstract and became something they could use.
of post-course respondents reported improved understanding of the key program topic (n=19).
selected field visiting among their most preferred learning activities.
“The parts that helped my learning most were the hands-on labs, field activities, and real-world case studies.”Anonymous post-course feedback
They were equally clear about what needed more time: lab practice, a slower introduction to unfamiliar tools, step-by-step QGIS and Jupyter guides, and deeper work on model validation and transferability. I am keeping those comments close as I redesign the next version.
Six ways students turned evidence into action
The selected work below comes from the final evidence-to-action projects in Ecological Environment and Sustainable Development – AI Empowering the Green Future. Projects ranged from campus shade and public-transit greening to park use and neighbourhood-scale green equity. These examples were selected for the clarity of their question, fit between method and evidence, honest treatment of limitations, and specificity of the proposed response.
Spatial inequality on the UBC campus
A dual-scale NDVI and Green View Index comparison found a 27.3-point GVI gap between Main Mall and the Bus Exchange. The proposal linked the diagnosis to staged greening targets for transit-dependent users.
View full posterHow garden conditions shape visitor use
Thirty minutes of systematic observation across three UBC Botanical Garden sites produced a deliberately bounded result: seating alone did not explain use. The action plan prioritised better use of existing assets and repeat measurement.
View full posterStanley Park’s green paradox
By combining overhead vegetation, pedestrian-visible greenery and geotagged visitor activity, the project revealed a mismatch between where vegetation is abundant and where people experience the park. A segmented micro-restoration strategy protected interior habitat while cooling the seawall.
View full posterWhen green from above is not green from the street
The Strathcona study placed public-tree records, satellite indicators and Mapillary street images side by side. The disagreement between lenses became the basis for a four-part strategy: protect, connect, retain and add.
View full posterA defensible first step for tree planting
A transparent screen combined pedestrian importance, canopy deficit and regional heat context across eight campus walkways. Crucially, the author framed the result as a sequence for feasibility review—not a substitute for on-site thermal measurement or accessibility checks.
View full posterGreener waiting at campus bus stops
A pedestrian-view audit of five bus stops identified a 42.3-point gap between the lowest and highest sampled GVI. The response was intentionally small and testable: audit a priority bay, build site-fit shade, then re-measure and learn.
View full poster
A digital future, and a human one
Across both courses, we expected digital tools to help students see environmental systems more clearly. They did. But the shared Urban Nature Digital Twin also revealed something less technical and equally important: every dataset begins with human attention.
The twin gained meaning through the routes students took, the photographs they selected, the observations they recorded and the disagreements they brought back to the classroom. The result was digital, but the learning was collaborative, situated and human.
The next iteration will keep this field-to-lab rhythm while giving beginners a clearer route into every tool.
- Protect more time for guided practice and debugging.
- Provide complete beginner workflows before offering optional technical extensions.
- Make validation, transferability and uncertainty visible in every lab.
- Continue using real places and public decisions as the organizing frame.
This story launches Teaching, a new Nature AI Lab news strand on how research methods become learning experiences. These two courses offer the starting point: different environmental themes, a shared evidence culture and a pedagogy that treats digital tools as part of a larger human process.
Explore more Nature AI Lab news or learn about our research.